Grafana 搭建
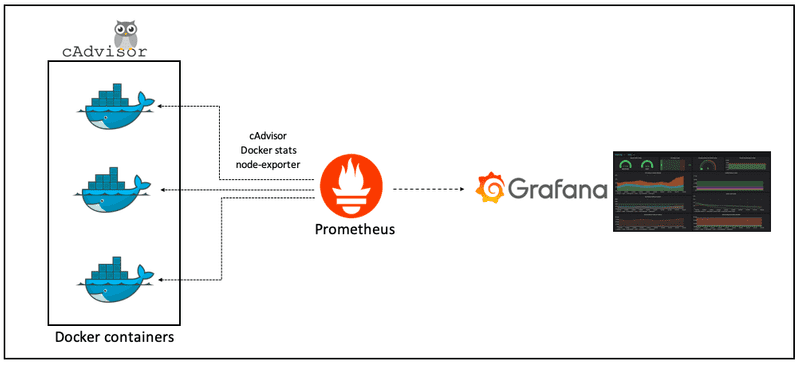
Grafana 和 Prometheus
Grafana 是一个开源的度量分析和可视化工具,可以用来展示 Prometheus 和其他数据源的数据。 Prometheus 是一个开源的监控系统和时间序列数据库,可以用来收集和存储时序数据。
使用 Docker 安装 Grafana
version: '3.4'
services:
  prometheus:
    image: prom/prometheus
    container_name: prometheus
    hostname: prometheus
    ports:
      - 9090:9090
    volumes:
      - ./prometheus.yml:/etc/prometheus/prometheus.yml
    command:
      - "--config.file=/etc/prometheus/prometheus.yml"
      - "--storage.tsdb.path=/prometheus"
      - "--web.console.libraries=/usr/share/prometheus/console_libraries"
      - "--web.console.templates=/usr/share/prometheus/consoles"
      - "--web.enable-lifecycle"
  grafana:
    image: grafana/grafana
    container_name: grafana
    hostname: grafana
    ports:
      - 3000:3000
    volumes:
      - ./grafana.ini:/etc/grafana/grafana.ini
      # 注意权限问题
      - ${GRAFANA_DATA_PATH}:/var/lib/grafana:rw
      - /usr/share/zoneinfo/Asia/Beijing:/etc/localtime
  # 对外暴露 Redis 的数据源
  redis-exporter:
    image: oliver006/redis_exporter
    container_name: redis-exporter
    hostname: redis-exporter
    restart: always
    command:
      - "-redis.addr=${HOST_IP}:${REDIS_PORT}"
      - "-redis.password=${REDIS_PASSWORD}"
    ports:
      - ${REDIS_EXPORTER_PORT}:9121
    volumes:
      # 注意时区的问题
      - /usr/share/zoneinfo/Asia/Beijing:/etc/localtime
  mysql-exporter:
    image: prom/mysqld-exporter
    container_name: mysql-exporter
    hostname: mysql-exporter
    restart: always
    ports:
      - "${MYSQL_EXPORTER_PORT}:9104"
    environment:
      DATA_SOURCE_NAME: "${MYSQL_USERNAME}:${MYSQL_PASSWORD}@(${HOST_IP}:${MYSQL_PORT})/${MYSQL_DATABASE}?charset=utf8mb4&parseTime=True&loc=Local&timeout=60s"
配置文件 prometheus.yml
global:
  scrape_interval: 15s # 默认15s 全局每次数据收集的间隔
  evaluation_interval: 15s # 规则扫描时间间隔是15秒,默认不填写是 1分钟
  scrape_timeout: 5s    #超时时间
  external_labels: # 用于外部系统标签的,不是用于metrics(度量)数据

# Alertmanager configuration
# 这里定义和 prometheus 集成的 alertmanager 插件,
# 用于监控报警。后续会单独进行 alertmanger 插件的配置、配置说明、报警媒介以及 route 路由规则记录。
alerting:
  alertmanagers:
  - static_configs:
    - targets:
      # - alertmanager:9093

# Load rules once and periodically evaluate them according to the global 'evaluation_interval'.
# 这个主要是用来设置告警规则,基于设定什么指标进行报警(类似触发器trigger)。
# 这里设定好规则以后,prometheus 会根据全局 global 设定的 evaluation_interval 参数进行扫描加载,规则改动后会自动加载。
# 其报警媒介和 route 路由由 alertmanager 插件实现。
rule_files:
  # - "first_rules.yml"
  # - "second_rules.yml"

# A scrape configuration containing exactly one endpoint to scrape:
# Here it's Prometheus itself.
scrape_configs:
  # The job name is added as a label `job=` to any timeseries scraped from this config.
  - job_name: 'prometheus'

    # metrics_path defaults to '/metrics'
    # scheme defaults to 'http'.

    static_configs:
    - targets: ['10.11.40.7:58001', 'redis-exporter:9121']
      labels:
        group: 'dev'
配置文件 grafana.ini 就不贴了,直接使用 默认的
在这里我们启动了三个服务
- Prometheus 普罗米修斯时序数据库,用来存储和查询你的监控数据
- Grafana 本尊
- redis-exporter 采集 Redis 的数据源
docker-compose up -d
- 初始的用户名是 admin
- 密码也是 admin
# 访问 Grafana
http://localhost:3000

# 访问 Prometheus
http://localhost:9090/graph

# 可以检查当前采集的对象
http://localhost:9090/targets
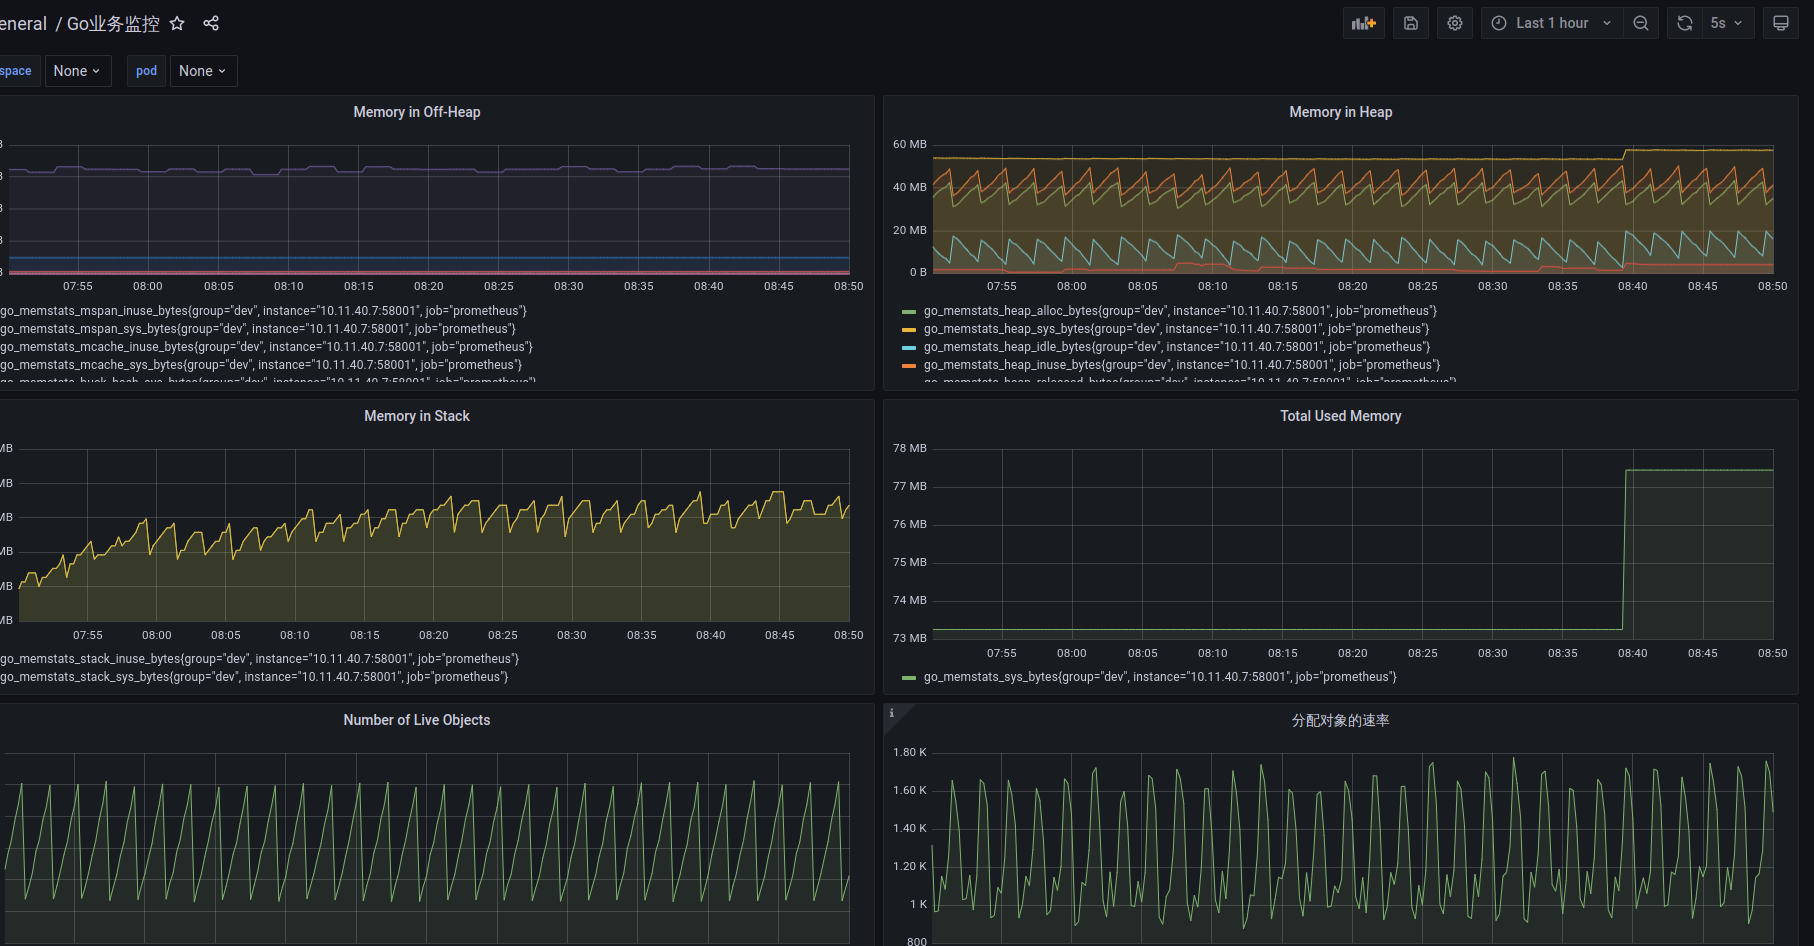
适用的仪表盘配置
https://grafana.com/grafana/dashboards/10826-go-metrics/
https://grafana.com/grafana/dashboards/17507-1-redis-exporter-dashboard/